Which training reports do executives actually read? The ones that answer a business question in under a minute: who is compliant and who is not, whether new people are productive yet, and whether training spend is moving a number the business cares about. Everything else is trivia, and most LMS dashboards are full of it. The fix is not more data. It is fewer reports, each built around a decision someone actually has to make.
Why Do Most Training Reports Get Ignored?
The default report in most systems is a completion report: who finished what, and when. It is easy to generate, so it is easy to over-produce, and it slowly becomes wallpaper.
The problem is not that completion data is wrong. It is that it answers a question nobody is asking at the leadership level. Executives do not make decisions based on course completions. They make decisions about budget, risk, and staffing, and a completion percentage does not move any of those levers on its own. A team at 98% completion could still be failing a compliance audit or onboarding people at half the expected pace. The number feels reassuring and says almost nothing.
There is a deeper issue too: reporting that only shows activity trains leadership to think of training as an activity, not an investment. Industry research on workplace learning consistently finds that most learning data is never used in a business decision, largely because it is presented in a form that does not connect to one. Once leadership learns that training reports do not help them decide anything, they stop opening them, and the reporting function loses its seat at the table.
Which Reports Actually Influence Decisions?
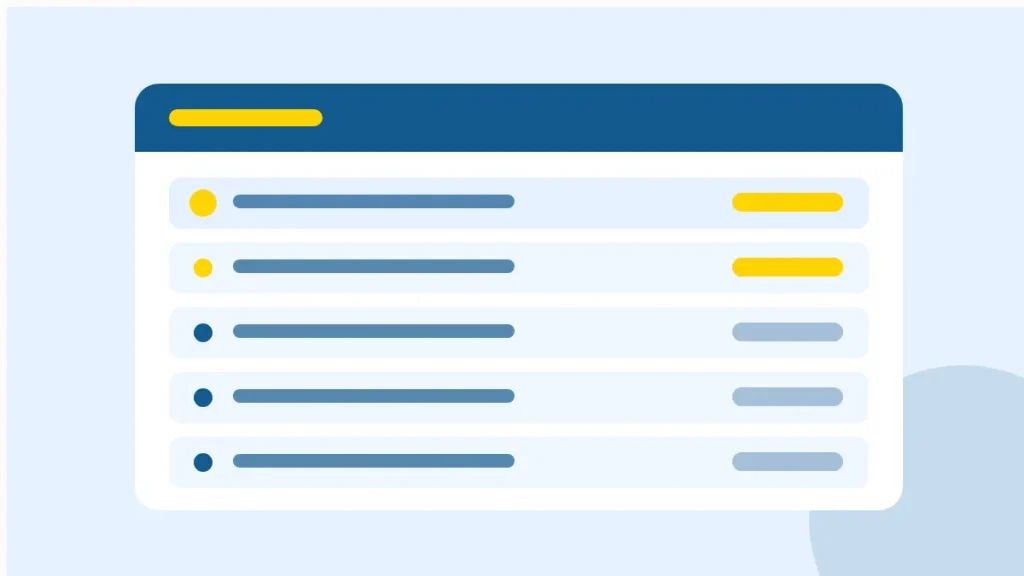
Reports earn a place in a leadership meeting when they answer one of three questions clearly.
1. Who is compliant right now, and what expires next?
This is the report that keeps the organization out of trouble. It should show, at a glance, current compliance status by team or location, everything expiring in the next 30, 60, and 90 days, and the specific people (not just counts) who are out of compliance or approaching expiration. Vague summaries create follow-up questions. Named lists create action. For a deeper look at what auditors expect to see, see LMS Compliance Reports: What Auditors Need to See.
2. Are new people getting productive on schedule?
Ramp-up reporting reframes onboarding as a business metric: time-to-productivity. Instead of “onboarding is 100% complete,” show whether new hires are hitting their 30/60/90 milestones on time, and where the delays pile up. If week three keeps slipping for one role, that is a staffing and revenue signal, not a training footnote. The structure behind this kind of program is laid out in What Does a Great New-Hire Onboarding Training Program Look Like?.
3. Is competence improving where it matters?
Completion says someone was present. Competence says they can now do the thing. The reports that matter here compare assessment scores against job requirements, track skills over time for critical roles, and flag where measured ability is below what the role demands. This is the difference between the two numbers discussed in LMS Completion Rates vs. Competency: Reading the Data, and it is the single biggest upgrade most reporting setups can make.
A fourth report matters in budget season, though it runs on an annual rhythm rather than a monthly one: the value report. That is the one that ties training investment to outcomes like turnover, error rates, or ramp time. Related reading: Training ROI Calculation: How to Measure L&D Program Value.
What Makes a Report Readable in Under a Minute?
Executives read at a scan. A report that needs explanation has already failed. Four properties separate the reports that get used from the ones that get archived:
- A headline answer. The first line states the conclusion: “94% compliant, 6 people expire before December 15.” No preamble, no methodology. The detail lives below the fold.
- Exceptions over averages. Averages hide the problems that need decisions. A report sorted so the failures and near-failures surface first turns data into a to-do list.
- Trends, not snapshots. A single point in time invites the question “is that good?” A three-month trend line answers it. Direction matters more than the current number.
- One owner per number. Every metric on the page should map to a person who can act on it. Metrics without owners become decoration.
This is also where format matters as much as content. A report that arrives as a scheduled PDF in the right inbox every month gets read. A report that requires logging into a system, finding the right filter, and exporting a spreadsheet does not, no matter how good the data is.
How Do You Build a One-Page Executive Dashboard?
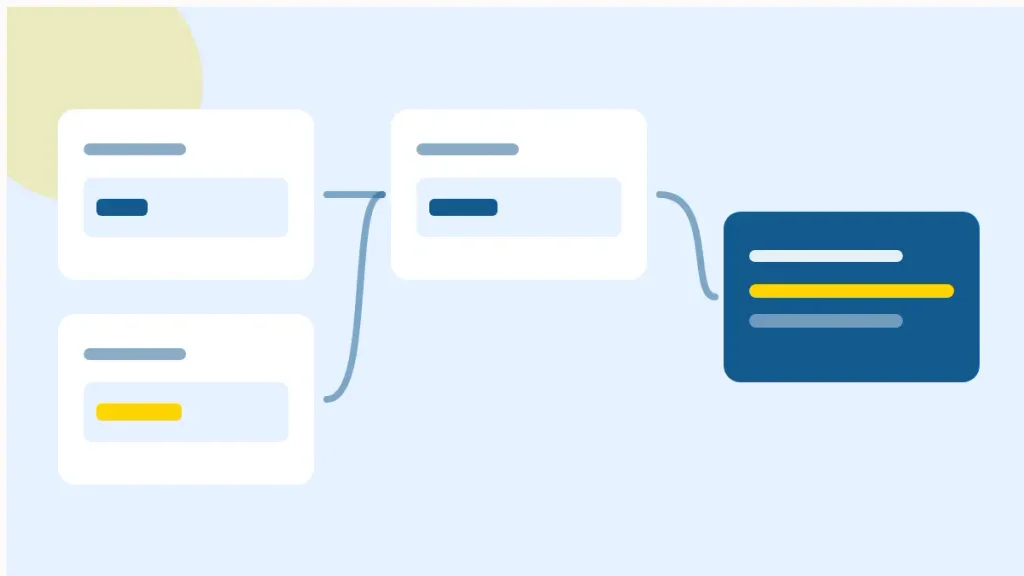
The practical starting point is a single page, updated monthly, with four blocks:
1. Compliance status. Percentage compliant overall, count and names of exceptions, and the next 90 days of expirations.
2. Ramp-up tracker. Current cohort progress against the 30/60/90 plan, with any roles running behind schedule called out.
3. Competence signals. Average assessment performance for the critical roles being tracked this quarter, against the benchmark.
4. One business connection. A single line tying training activity to a business metric, even a rough one. “New customer service hires reached call-ready an average of 4 days faster this quarter” beats an entire appendix of completions.
Axis LMS reporting is built to support exactly this kind of assembly: standard reports for completions and compliance, assessment-level reporting for competence, custom reports for the metrics a specific leadership team cares about, and scheduled exports that deliver the finished page automatically rather than waiting for someone to pull it. The reporting layer does the gathering on a schedule; the one-page format does the editing.
The discipline is subtraction. The first version of this page usually tries to include ten metrics. The version that survives is the one where anything that did not inform a decision in the last two cycles gets cut. A dashboard earns its place the same way any report does: by being the page someone opens first when they need to know something.
What Should You Stop Reporting?
Retirement is part of building a dashboard people read. Three candidates go first:
- Raw activity logs. Who logged in and when is system administration, not insight. Keep it available for audits; take it off the executive page.
- Course-by-course completion tables. If a course completion has no decision attached, it belongs in a drill-down, not a headline. Aggregate at the program or competency level instead.
- Vanity comparisons. “Hours of training delivered” grows every year by definition. If a number can only go up and connects to nothing, it is not a metric, it is a counter.
Cutting these does more than clean up the page. It changes the conversation. When the report only contains questions leadership can act on, the meeting shifts from “what am I looking at?” to “what do we do about the six people who expire next month?”
Frequently Asked Questions
How often should executive training reports be produced?
Monthly is the cadence most leadership teams can absorb without tuning out, with a more complete quarterly review for budget and planning decisions. Compliance exception data should be available continuously and escalated automatically rather than waiting for the monthly cycle.
What is the most important training metric for leadership?
There is no universal answer, but the strongest candidates are time-to-productivity for new hires, compliance status for regulated operations, and competence scores for business-critical roles. Pick based on what the organization is accountable for this year, not on what the LMS makes easiest to graph.
How do you get executives to actually look at training data?
Deliver fewer numbers, connect each one to a decision or a risk, and send it where they already read: a scheduled one-page summary rather than a dashboard they have to log into. Consistency of format matters as much as the content; a page that looks the same every month gets read every month.
Should training reports be automated or built by hand?
Automate the delivery, curate the content. Scheduled reports and exports should handle the collection and distribution so the monthly page is not a manual scramble, but a person should still choose which numbers lead the page, because that editorial judgment is what makes it readable.
